One of the most reliable candle formations you can see on the Forex chart is the pin bar. Many traders consider this as one of the most powerful candlestick patterns for trading. So today’s discussion will be dedicated entirely to the pin bar reversal candle. Let’s dive in.
The Pin Bar Setup
I bet you have seen many pin bars on your Forex charts. Maybe you haven’t been aware that you are looking at a pin bar formation per se, but you most likely have come across this candle:
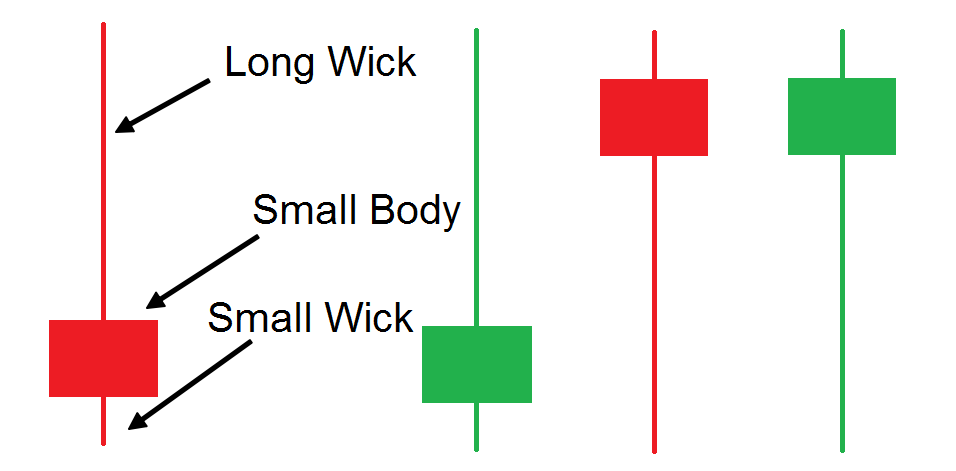
Above you see the structure of the pin bar candlestick pattern and its four variations. The candle’s unique structure includes a long candlewick, a small body, and a small candlewick opposite the long candlewick. An important rule for identifying a pin bar is that the long wick should comprise at least 2/3 the size of the entire candle. Some traders find it useful to program a Pin Bar indicator in Metatrader or their preferred trading platform to make it visually easier to spot on the chart.
Many traders believe that the name “Pin Bar” comes from the pin like or needle like appearance of the candle. Actually, the name “Pin Bar” is short from “Pinocchio Bar” which was popularized by Martin Pring in his book “Technical Analysis Explained”.
The pin bar candle can be seen frequently on a Forex chart. However, the best tradeable pin bars are usually located at the end of an impulse wave, and extends outside of the preceding price action. When traders see a pin bar sticking out above or below the recent price action after a prolonged move, they could prepare to trade contrary to the trend attempting to catch the reversal price momentum.
Pin bars can be thought of as a price rejection zone, where major market participants have rejected price from staying at a particular price level. Before the price action closes a pin bar, the candlewick has initially been part of the candle’s body.
In this manner, before being completed, the pin bar candle has seen a large body in the direction of the trend. This creates the impression that the trend might continue with strength. However, contrary pressure appears and the candle closes near its open level, which ultimately appears as a big candle wick. Typically “The bigger the nose (wick) the bigger the lie”, referring to the unsuccessful big candle body, which has ended up being a wick. This is where the “Pinocchio” name comes from. Therefore, the bigger the wick the pin bar has, the stronger the reversal pressure is expected to be!
Bullish Pin Bar
A valid, tradeable bullish pin bar is located at the end of a bearish trend and its lower candle wick goes below the overall price action. If you spot a bullish pin bar setup on the chart, this will setup a nice opportunity for a long position.
Bearish Pin Bar
The same is true for bearish pin bars but in the opposite direction. The bearish pin bar is located at the end of a bullish trend and its longer candle wick is the upper area. In this manner, the longer wick is sticking out above the price action. The bearish pin bar is usually a good sign of an upcoming price reversal in the bearish direction.
Pin Bar Chart Examples
In general, when trading pin bars, speculators should look for big candle wicks forming beyond the recent price action after a prolonged price move. There are usually the best pin bar formations to trade. However, pin bars can also be valid during a trend, as prices are taking a pause or taking a breather prior to the resumption of that trend.
Pin bars formations that should be avoided are the ones which are counter to the trend but that do not stick above/below the general price action. In addition to this, pin bar signals that occur during a period of consolidation should also be avoided. Now have a look at the image showing you some pin bar formations on the chart:
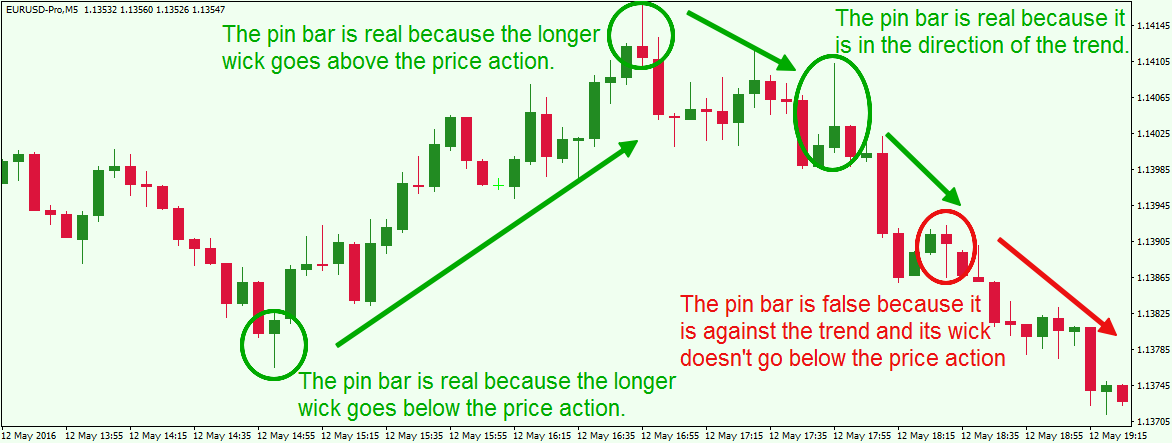
The chart above starts with a bearish trend. At the end of the tendency the price action creates a bullish pin bar. The longer wick sticks out below the price action. Therefore, we confirm the pattern to be real. The price then shifts its direction and starts increasing.
After a prolonged bullish move, we get a bearish pin bar. The longer wick of the candle sticks out above the recent price action. Therefore, we confirm the reversal character of the candle. The price starts decreasing afterwards.
On the way down we see another bearish pin bar. However, its longer candlewick doesn’t stick out. Nevertheless, we could consider this a tradeable pin bar, because it is in the direction of the trend. It confirms the potential for a downward price movement. As you see the price continues the down run after this pin bar signal.
Later on, we spot a bullish pin bar on the chart (red circle). The candle has a reversal character. However, the longer wick doesn’t stick out below the price action.
Therefore, we can conclude that this pin bar is not a valid signal, since there is no real price rejection evidence to foretell a reversal of the bearish trend. Soon the chart validates this was a false pin bar and the price decrease continues.
By now you may have noticed that these Forex pin bar formations look like the hammer candlestick pattern and shooting star candlestick pattern. And if you did recognize this, you would be one hundred percent correct, as they are one in the same. The hammer and the shooting star are types of pin bar variations.
Price Action Trading with Pin Bars
As you know, successful forex trading is not only about identifying different patterns on the chart. We must know how to take advantage of the different chart patterns and incorporate a strategy around it.
Now that you are familiar with properly identifying pin bars on your price chart, we can now show you how to trade these formations.
Opening a Pin Bar Trade
When you spot a valid pin bar on the chart you should be aware of when to enter a trade. There are many different entry and exit strategies around pin bars, and in the following section, I will discuss one of these timing strategies as an example.
Bullish Pin Bar – When you identify a valid bullish pin bar you could buy the Forex pair at the first candlestick which closes above the small wick of the pin bar.
Bearish Pin Bar – When you spot a valid bearish pin bar setup, you could sell the Forex pair at the first candlestick which closes below the small wick of the pin bar.
Stop Loss on Pin Bars
As with every other trade setup, you should never be unprotected during your trade. Make sure you always use a stop loss order. Let’s discuss where we would place the stop loss order when trading the pin bar candle.
When you enter the market on a pin bar pattern, you should place your stop loss order right above/below the longer candlewick of the pattern. The distance between the entry level and the end of the longer candlewick is the approximate distance that should be allowed for the trade to work.
Make sure you are not using the exact high/low of the wick when placing the stop loss order. As a best practice you should leave some additional room beyond that to avoid getting caught in a stop run. We can assume that If the price goes beyond the longer candlewick, then the pattern is considered unsuccessful.
Take Profit in Pin Bar Trades
You now have some ideas on how to enter the market on pin bars and where to put your stop loss. So the next logical question becomes “Where should we exit our trade”. And that is what we will look to answer now.
Measure Distance based on the Size of the Pin Bar – Trades can use this approach for exiting candle pattern based trades. You can use one, two, or three times the size of the pin bar to determine the target. It is up to you which multiplier you would like to use in your own trading program. However, whatever you decide on when you build your pin bar strategy, make sure to use the same target approach for every trade – one, two, or three times the size of the pin bar. Also, keep in mind, that the bigger the target is, the lower the success rate will be, and the lower the target is the higher the success rate will be.
Use Price Action Rules – This approach involves applying simple support/resistance rules, in a combination with chart and candle patterns. Why exit a trade, where the price is still trending in our favor? If the price breaks a crucial support during our long trade, this can be a clear sign that we should close the trade. Also, if you spot another reversal candle pattern when the price is trending in your favor, you might want to close your trade at that time. The are many options available for the astute price action trader to manage their pin bar trade.
A Pin Bar Trading Strategy
Now we look to combine all the rules we discussed above to create a coherent trading methodology around the pin bar setup. Our pin bar trading system will start with opening a trade after a candle is closed beyond the smaller wick of the pattern. The stop loss will be located beyond the longer wick of the pattern. We will use price action techniques for determining the right time to close the trade. Have a look at the image below:
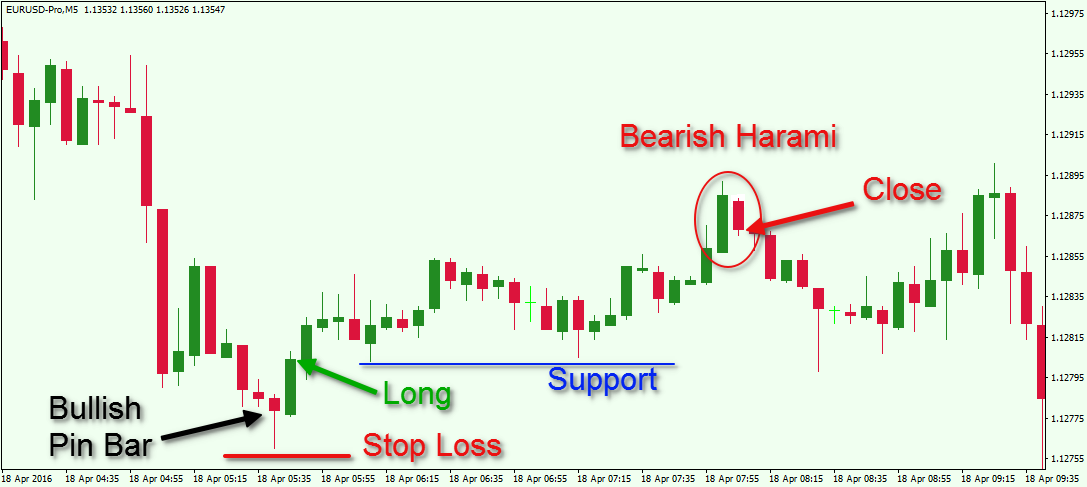
Let look at the EUR/USD chart above. The graph starts with a price decrease. Suddenly we see a bullish pin bar candle on the chart. The lower candle wick goes below the general price action. Therefore, we confirm the authenticity of the pattern.
The next candle which comes after the pin bar closes above the upper wick of the pattern. This is the right moment to open a long trade based on our pin bar trading plan. The price increases afterwards. Notice that on the way up, the EUR/USD creates a clear support level (blue line). If the price breaks this support downwards, then the trade should be closed based on the price action rules.
The support manages to hold the pressure of the price and the EUR/USD makes a new bullish run. At the end of the second bullish impulse we spot a Harami Reversal candle pattern. This formation could likely reverse the bullish trend which came after the pin bar pattern. Based on this price action, we might feel that this would be the right moment to close.
Let’s now illustrate a bearish pin bar trade example:
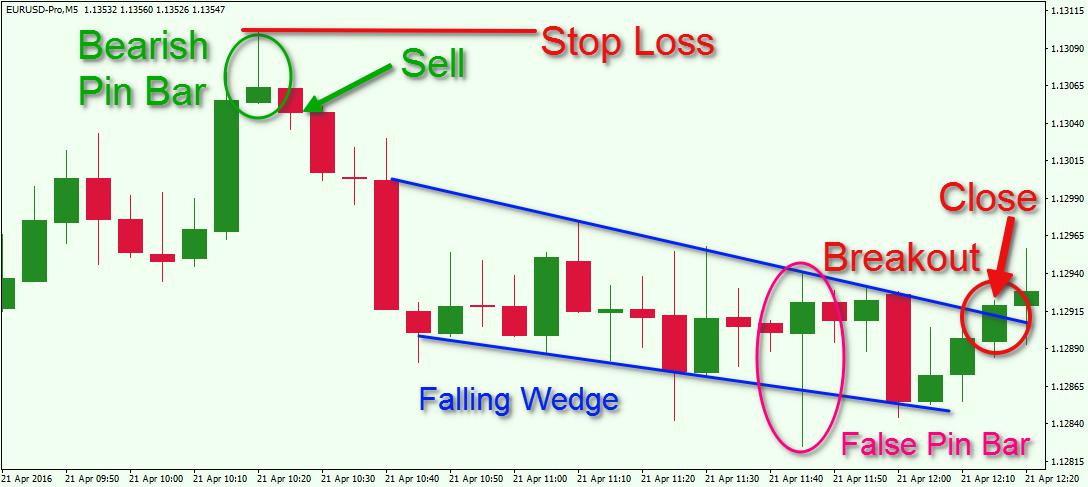
Again we have a EUR/USD chart above. The chart starts off with a bullish price move, which ends with a bearish pin bar candle formation. The longer wick of the pattern goes above the general price action, which confirms the authenticity of the candle.
The next candle which comes after the pin bar is bearish. As you see, it closes right below the tiny lower wick of the pin bar. This creates a short signal on the chart based on our rules.
Subsequently the price moves in the bearish direction. After the rapid decrease the price enters a consolidation phase, which resembles a falling wedge chart pattern. This figure has a strong bullish potential in case the upper level of the wedge gets broken. Therefore, the upper level could be used as an exit signal in this case.
Notice that the price action creates a bullish pin bar candle pattern inside the wedge. Although the longer wick goes below the price action, we should disregard this pattern, because it is formed during price consolidation.
Later the price action closes a candle above the upper level of the Falling Wedge. This creates a strong bullish signal on the chart. In this manner, we could decide that this is the right moment to exit the trade.
Let’s now go through a final pin bar trading example:
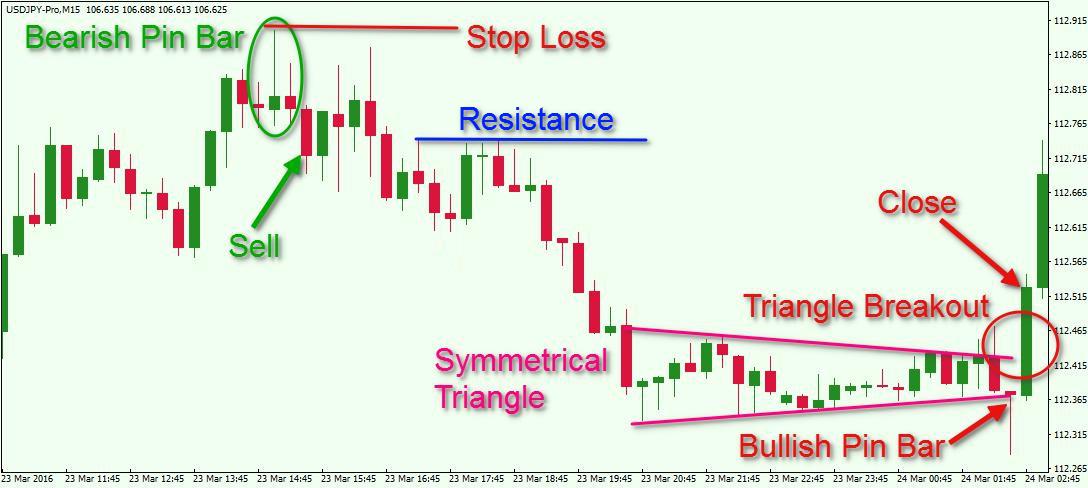
The image above displays the chart of the USD/JPY Forex pair. We see a bullish trend, which ends with a bearish pin bar candle pattern. Although the body of the candle is located below the previous three, the longer candlewick goes above the general price action on the chart. This confirms the presence of a valid bearish pin bar on the chart.
A couple of candles later the price action breaks the lower candle wick of the pin bar, which creates a short signal on the chart. Based on the entry rules, this is the right moment to sell the USD/JPY Forex pair. Soon after the price begins to move downwards. On the way down, one of the trend corrections creates a resistance area, which could be used for closing the trade. However, this resistance stays untouched and the trade should be held further.
The price continues the decrease with an even sharper pace. At the end of the second bearish impulse, the price action enters into a consolidation phase. Note that the consolidation resembles a symmetrical triangle. The upper level of this chart pattern could be used to close our short trade in this case.
Notice that at the end of the triangle formation, the price action creates a bullish pin bar pattern. The longer wick goes below the general price action, which means that the pattern is significant. This candle could be used as an early exit from the short trade. Otherwise, the exit signal comes when the price action closes a candle above the symmetrical triangle on the chart.
Conclusion
- The pin bar candlestick pattern is one of the most powerful and easily recognizable candle patterns available.
- The pin bar has a small body, a long candle wick which is at least twice the size of the entire candle, and a small candle wick opposite the long candle wick. The Hammer and the Shooting Star are types of pin bar candle patterns.
- The name “Pin Bar” comes from “Pinocchio Bar”. The explanation for this is hidden in the price momentum, which pushes the candle to a rebound, creating a long candlewick. Traders attempt to catch this reversal pressure, which is likely to be stronger, if the wick of the pin bar is longer. In this manner traders say: “The bigger the nose (wick), the bigger the lie (the reversal)”, which refers to Pinocchio.
- There are two types of pin bar candle patterns:
- Bullish Pin Bar – It has long lower candle wick, small candle body and a small upper candle wick.
- Bearish Pin Bar – It has a long upper candle wick, small candle body and a small lower candle wick.
- A valid pin bar is one, wherein the wick goes above (or below) the price action. The highest probability pin bars are reversal signals that come after a prolonged price move.
- A false pin bar is one wherein the long wick doesn’t stick out from the recent price action. Other pin bars which should be avoided are ones that occur during tight range bound conditions.
- A Pin bar strategy could be traded the following way:
- Identify a valid pin bar.
- Open a trade in the direction of the pin bar when a candle closes beyond the smaller wick of the pattern.
- Put a stop loss beyond the longer wick of the pin bar.
- Use a multiple of the size of the pin bar as a target, or apply simple price action rules in order to exit the trade.